

Heatmap anomalies
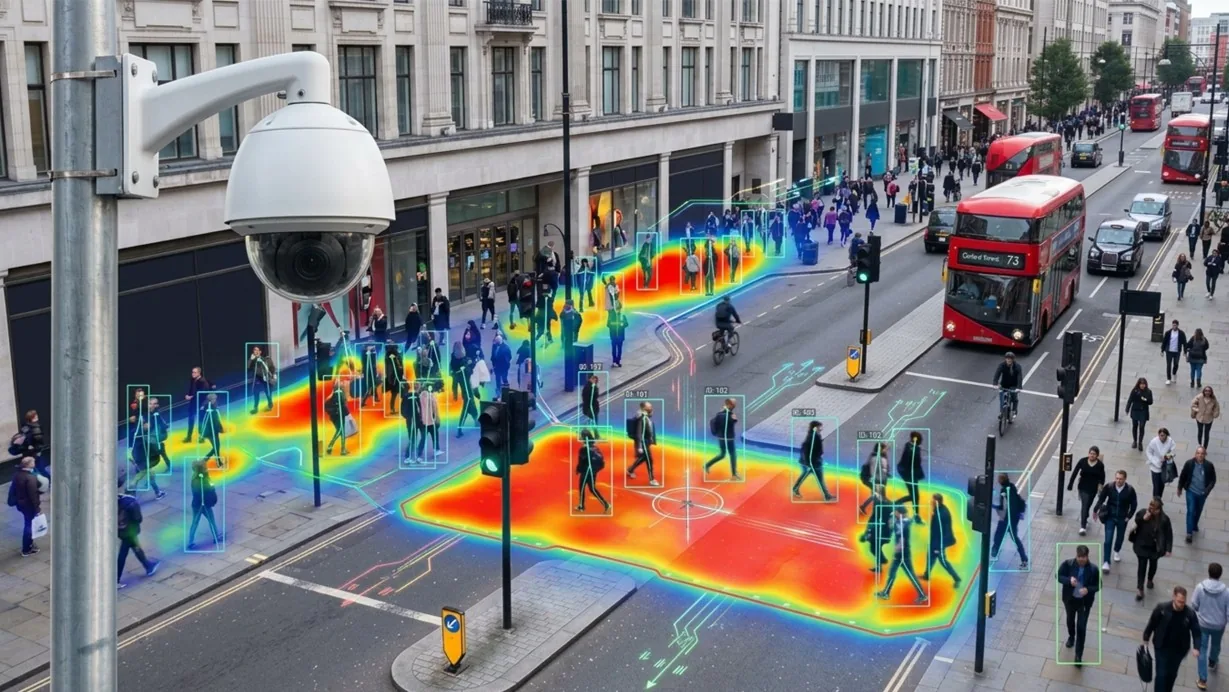
Heatmap anomalies maps foot traffic across a site and flags patterns that deviate from the established baseline — unusual congestion, empty zones, or unexpected activity.
- Foot traffic congestion above the normal pattern for a zone
- Activity in a normally low-traffic area outside expected hours
- A monitored area sitting unusually empty during typically…
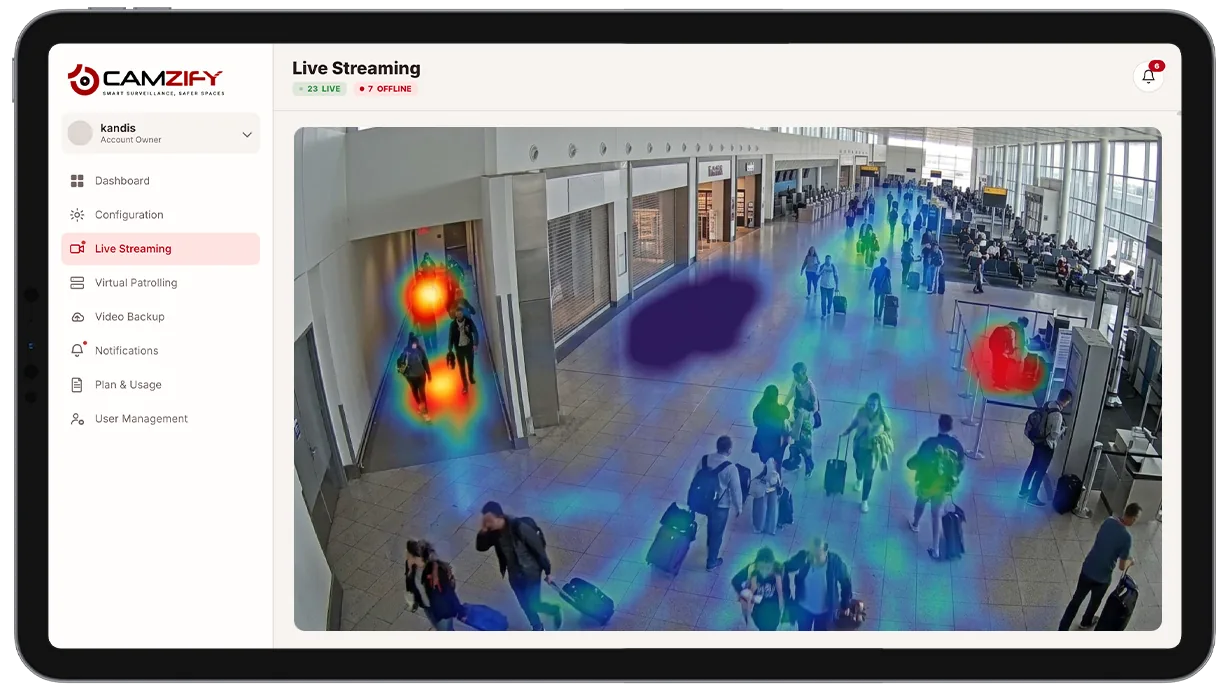
This capability detects and alerts on:
- • Foot traffic congestion above the normal pattern for a zone
- • Activity in a normally low-traffic area outside expected hours
- • A monitored area sitting unusually empty during typically busy hours
- • A visual heatmap overlay for layout and staffing decisions
- • Zone-to-zone comparison to spot where traffic is shifting on a site
- • Anomaly history reviewable alongside other site events
Why heatmap anomalies matters
Most foot traffic on a site is unremarkable, people moving through as expected, at roughly the volume you'd expect for the time of day. The interesting moments are the exceptions.
- A corridor is suddenly congested.
- A normally busy lobby has gone quiet.
- A back area shows activity at an hour when nobody should be there.
Those exceptions are easy to miss without something actively watching for them. A single fixed rule, "alert if more than N people are in this zone", doesn't capture what "unusual" actually means for a given area, because normal varies by zone, by hour, and by day of week. A number that's alarming in a back corridor at 2am is completely ordinary in a lobby at lunchtime.
Heatmap anomalies solves this by comparing current traffic against a baseline built specifically for each zone, rather than a single threshold applied everywhere. That's what lets it flag a real deviation instead of either missing it or flooding the queue with false alerts.
How it works
Building the baseline
Confirmed subject counts from multi-object tracking are aggregated per zone over time to build a baseline traffic pattern for each area of the site.
Detecting a deviation
Current traffic is continuously compared against that baseline. A deviation beyond the configured threshold, in either direction, flags an anomaly with the affected zone and time window.
Where the data feeds
Heatmap data also feeds the platform's analytics and reporting module for trend review independent of any single anomaly.
Configuration
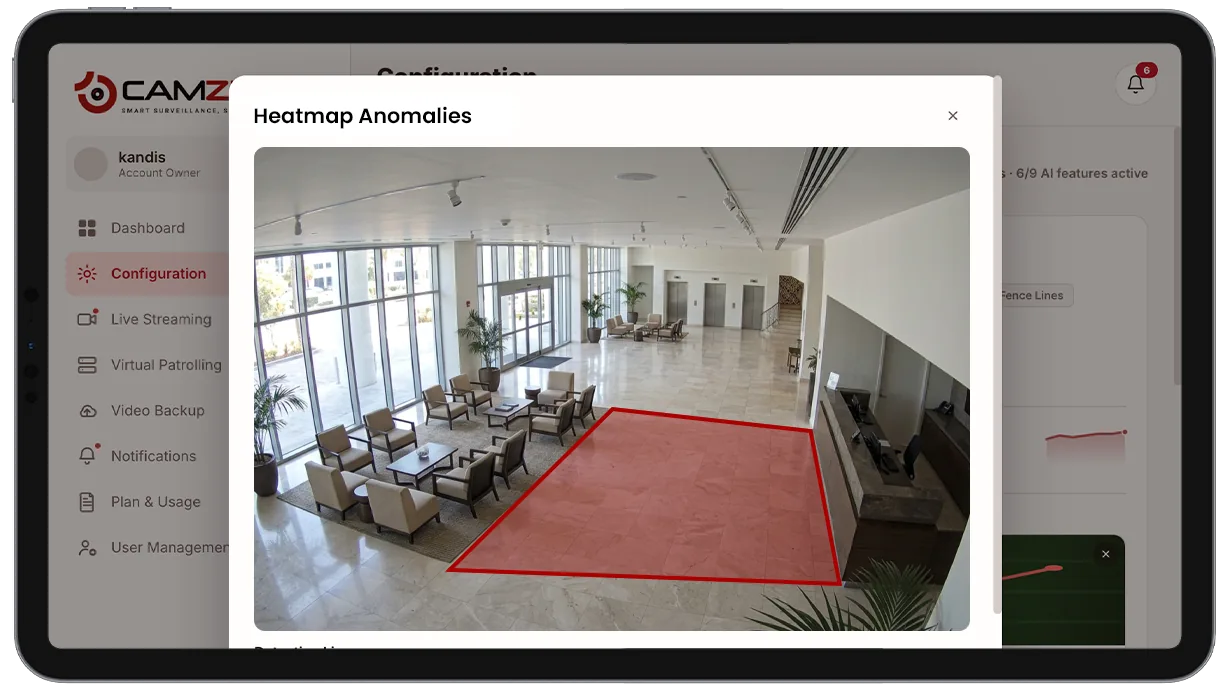
Zones are marked on the camera view or site map. Each zone supports:
- • Zone boundaries marked on the camera view or site map
- • Anomaly sensitivity threshold, configurable per zone
- • Baseline learning period before anomaly flagging goes active
- • Notification window per camera, e.g. notify in business hours only
- • Per-camera instance licensing

Common scenarios
- • A retail aisle showing unusual congestion outside a promotional period
- • A back-of-house corridor with unexpected foot traffic after closing
- • A lobby sitting unusually empty during a normally busy morning window
- • A queue forming in an area not designed for queuing, flagged for layout review
- • A traffic pattern shift near a restricted-adjacent zone worth a security look
- • A seasonal deviation from baseline that operations teams review before adjusting staffing
In a patrol round
Heatmap anomalies run as continuous background analytics rather than a per-camera checklist item during a virtual patrol round, but a flagged anomaly at a patrolled site is visible alongside that site's patrol reports.
The footage around each alert is kept under the camera's own retention window on cloud video surveillance, so the clip and the recording it came from are on one account.
Industries using this
Related detections
Frequently asked questions
See the detections on live cameras
A 15-minute demo of the live product: the detections your site needs, running on real camera feeds, and a quote per camera for your sites.